NASA data shows 10% increase in global greening in the last 20 years (not what you might think)

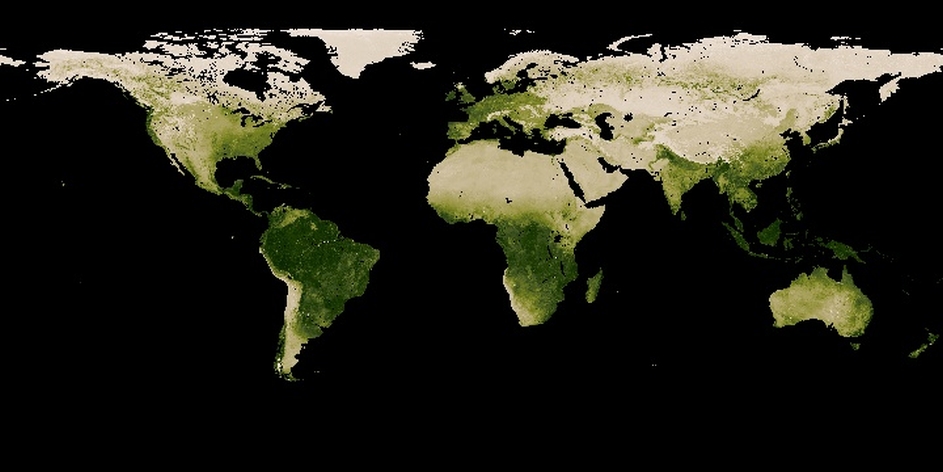
Although 70% of the Earth’s surface is a relatively unchanging ocean covered with water, the remaining 30% is occupied by land covered with forests and vegetation. Using data collected from NASA and NOAA’s next-generation Earth-observing satellite system called the Suomi NPP satellite, scientists are able to show subtle differences in greenness using the Visible-Infrared Imager/Radiometer Suite (VIIRS) instrument onboard the satellite.
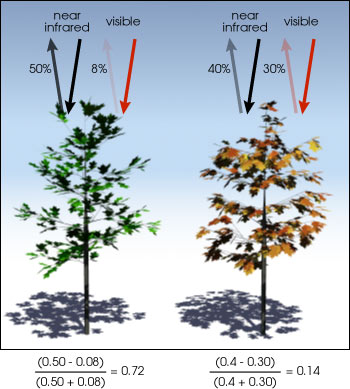
The raw satellite data is later transformed to show a simple graphical indicator known as normalized difference vegetation index (NDVI) that is later used to analyze remote sensing measurements, often from a space platform, assessing whether or not the target being observed contains live green vegetation.
According to United States Geological Survey (USGS), NDVI values range from +1.0 to -1.0. Areas of barren rock, sand, or snow usually show very low NDVI values (for example, 0.1 or less). Sparse vegetation such as shrubs and grasslands or senescing crops may result in moderate NDVI values (approximately 0.2 to 0.5). High NDVI values (approximately 0.6 to 0.9) correspond to dense vegetation such as that found in temperate and tropical forests or crops at their peak growth stage. Although there are several vegetation indices, one of the most widely used is the Normalized Difference Vegetation Index (NDVI).
Based on the analysis of data collected over the past two decades, NASA satellite data shows that the Earth is getting greener since 2000. This seasonal progression of global vegetation is driven by the tilt of the Earth’s rotational axis and its annual orbit around the Sun.
Just as describes above, NASA is able to calculate the “Vegetation Index by carefully measuring the wavelengths and intensity of visible and near-infrared light reflected by the land surface back up into space, scientists use an algorithm called a ‘Vegetation Index’ to quantify the concentrations of green leaf vegetation around the globe.”
Science blogger Zoe Phin downloaded and analyzed NASA’s cache of Vegetation Index data to identify the trend over time. She found that over the past 20 years, the vegetation index has increased from 0.0936 to 0.1029, which is a 9.94% increase, a “10% global greening in just 20 years. That’s the end of the good news.
The NDVI is calculated from these individual measurements as follows:
where Red and NIR stand for the spectral reflectance measurements acquired in the red (visible) and near-infrared regions, respectively.

Now the bad news

Source: NASA
To put this into perspective, this is actually bad news for the planet. As explained above, a value of zero means no vegetation, and close to +1 (0.8 – 0.9) indicates the highest possible density of green leaves. Even with a 10-year increase (from 0.0936 to 0.1029) in the vegetation index, we’re still closer to zero than we’re to 1. (Please look at the tree on the second right of the picture with an NDVI of 0.14)
Additionally, for those who think the current value of the new NDVI value of 0.1 is a good thing for the planet, environmental scientists already saying this is not such good news after all. In a 2018 piece written by the New York Times, Elliott Campbell, an environmental scientist at the University of California, Santa Cruz, along with his colleagues published a study that concluded that “plants are now converting 31 percent more carbon dioxide into organic matter than they were before the Industrial Revolution.”


