IHME releases new map of when U.S. states could consider easing social distancing and potentially get people back to work

As coronavirus spread across the United States, the White House Coronavirus Task Force issued social distancing guidelines in mid-March, recommending that gatherings of more than 10 people be avoided and that individuals stay at least 6 feet away from others. At the of March, the Task Force later extended the guidelines to April 30 based on models from the Institute for Health Metrics and Evaluation (IHME), which showed the peak in the death rate was likely to hit until the end of April.
As we enter the phase of the epidemic when government officials are considering when certain types of distancing policies may be eased, IHME released new estimates on when the country could shift from mitigation to containment strategies.
The estimates assume that when social distancing policies will be eased, such actions will occur in conjunction with public health containment strategies. Such measures include widespread testing, contact tracing, and isolation of new cases to minimize the risk of resurgence while maintaining at least some social distancing policies to reduce the risk of large-scale transmission (e.g., bans on mass gatherings).
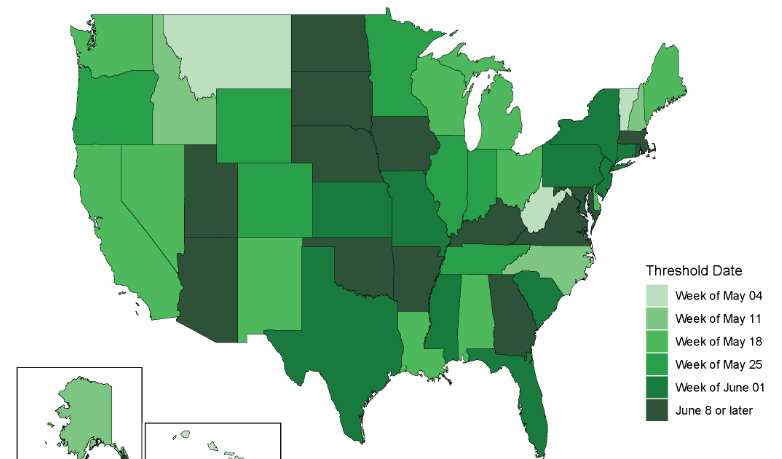
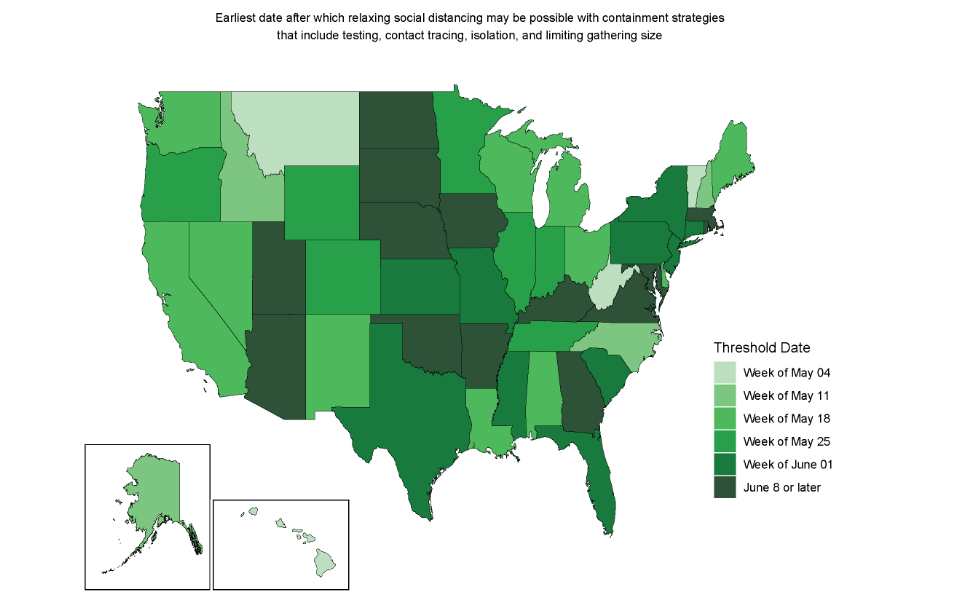
IHME also released a new map of when U.S. states could consider easing social distancing if containment measures are in place. Below are key findings from IHME.
- Based on our initial estimates, the earliest that some states may be able to ease presently implemented distancing policies – conditional on strong containment measures – appears to be in early to mid-May (lighter greens in the map below). This means, given the current epidemic trajectories and assuming these states have instituted robust containment strategies (e.g., widely available testing, contact tracing and case-based isolation, restricting mass gatherings), states including Alaska, Hawaii, Idaho, Montana, New Hampshire, North Carolina, Vermont, and West Virginia could potentially fall below 1 prevalent case of COVID-19 per 1,000,000 (1 million) around the first or second week of May.

- Predicted peak for daily COVID-19 deaths. Nationally, the predicted peak for daily COVID-19 deaths appeared to be on April 15, reaching 2,481 deaths. This is a slightly higher and later peak than our last release on April 13: based on data through April 12, it seemed as if the national peak would occur around April 13 at 2,150 deaths (estimate range of 464 to 7,084). Updates in available data and corresponding model improvements are the main drivers of this small shift.
- At the state level, much more variation remains in terms of projected COVID-19 daily death peaks – as well as identifying which states may have passed their epidemic peaks in recent days. In the table below are states that either appeared to reach their peaks in daily COVID-19 deaths or are projected to potentially reach their peaks before the end of April.Note that here and in our visualization tool we report on predicted peak dates and corresponding predictions for COVID-19 daily deaths. Reported daily death data may be higher for earlier dates, but because of known data lags and heaping on certain days (as discussed in prior updates), we focus on predicted peak dates to avoid issues with highly noisy data.
| State | Predicted peak date of daily COVID-19 deaths | Predicted daily COVID-19 deaths at peak: average projection (estimate range) |
| Massachusetts | April 15 | 264 |
| Connecticut | April 15 | 197 |
| Idaho | April 15 | 6 |
| Maine | April 15 | 4 |
| New York | April 16 | 837 |
| New Jersey | April 16 | 362 |
| Illinois | April 16 | 124 |
| California | April 16 | 96 |
| North Carolina | April 16 | 20 |
| Alabama | April 16 | 15 |
| Delaware | April 16 | 9 |
| Arkansas | April 16 | 4 |
| Vermont | April 16 | 4 |
| West Virginia | April 16 | 2 |
| Hawaii | April 17 | 5 (0 to 17) |
| Maryland | April 20 | 46 (4 to 219) |
| Rhode Island | April 25 | 18 (2 to 82) |
| Utah | April 25 | 7 (1 to 26) |
- Predictions for cumulative deaths. Across the US, projected cumulative COVID-19 deaths could reach 60,308 (estimate range of 34,063 to 140,381) during the epidemic’s first wave. Today’s release is somewhat lower than the average US predictions for cumulative COVID-19 deaths published on April 13 (68,841, with an estimate range of 30,188 to 175,965), though the uncertainty intervals still overlap considerably.
This change is at least partially driven by higher cumulative estimates for a subset of states, particularly in New York and New Jersey. At the same time, other states like Massachusetts, Connecticut, Georgia, and Florida now have lower average projections for their cumulative daily COVID-19 deaths through the epidemic’s first wave.


