US Inflation hits a 40-year high, rises to 8.6% in May even as U.S. tech layoffs top 17,000

Earlier this week, we wrote about Tesla CEO Elon Musk after he said he had a “super bad feeling” about the economy and wants to cut about 10% of jobs at his company. Musk’s instinct was right. He foresaw what most financial experts failed to see, including the US Treasury Secretary.
Today, The US Labor Department (DOL) has come out with its latest inflation data and it’s not looking good. In fact, it’s getting worse. According to DOL, the consumer-price index increased 8.6% in May from the same month a year ago, marking its fastest pace since December 1981.
U.S. inflation reached a new four-decade high of 8.6% in May https://t.co/iT5EkVYITo
— The Wall Street Journal (@WSJ) June 10, 2022
The ripple effect of inflation is everywhere including in the tech sector. So far, at least 50 tech companies have either laid off their employees or plan to do so in the near future.
As of June 7, there have been at least 17,000 employees laid off in mass job cuts in the U.S. tech sector so far this year, according to data layoff tracking data from CrunchBase. More tech companies are also planning to trim their workforces to counter market challenges amid the global economic downturn.
Meanwhile, US Treasury Secretary Janet Yellen admitted last week that she was wrong a year ago when she said she anticipated inflation would be “a small risk,” and “manageable. In an interview with CNN’s Wolf Blitzer, Yellen said:
“I think I was wrong then about the path that inflation would take. As I mentioned, there have been unanticipated and large shocks to the economy that have boosted energy and food prices and supply bottlenecks that have affected our economy badly that I didn’t at the time … fully understand. But we recognize that now.”
In just the last two decades, the US inflation rate has gone from $2.8% in 2001 to 8.6% in 2022. The highest jump was between 2021 and 2022 when inflation jumped by about 4%.
Inflation in the United States:
2022: 8.6%
2021: 4.7%
2020: 1.2%
2019: 1.8%
2018: 2.4%
2017: 2.1%
2016: 1.3%
2015: 0.1%
2014: 1.6%
2013: 1.5%
2012: 2.1%
2011: 3.2%
2010: 1.6%
2009: -0.4%
2008: 3.8%
2007: 2.8%
2006: 3.2%
2005: 3.4%
2004: 2.7%
2003: 2.3%
2002: 1.6%
2001: 2.8%— World of Statistics (@stats_feed) June 10, 2022
As you may recall late last year, Twitter founder Jack Dorsey warned about how “hyperinflation is going to change everything.” But economists and the so-called financial experts were so quick to dismiss what he said. Some even went as far as saying Jack is not a trained economist and didn’t know what he was talking about. Whether you agree with Jack or not, inflation is everywhere. We can see the effect of inflation on items we purchase at grocery stores, gas stations, and other places.
Fast forward two weeks later, the Labor Department reported that prices for U.S. consumers jumped 6.2% from a year ago in October, as surging costs for food, gas, and housing left Americans grappling with the highest inflation rate since June 1982. The number is far higher than the +5.9% year over year (YoY) expected and accelerating from September’s 5.4% YoY. At this rate, it won’t take long before the US turns into a banana republic.
Here is how Jack responded to the news. “now try measuring using the pre-1980 methodology…,” Jack tweeted.
now try measuring using the pre-1980 methodology… https://t.co/zJEBbg7zo5
— jack (@jack) November 10, 2021
‘Those who do not learn history are doomed to repeat it,” Philosopher George Santayana said in his famous quote. Santayana’s quote perfectly sums up what the U.S. Federal Reserve has been doing for at least two years now. As we reported last year, 40% of US dollars in existence today were printed in the last 12 months. History taught us that the best way to fight inflation is to stop printing money and increase the interest rate.
But the Federal Reserve is in a precarious position–The Federal Reserve cannot afford to stop printing money and increase the interest rate due to fear of the stock market collapse. Just like drug addiction, bankers and politicians’ friends on Wall Street are addicted to free money. On the other hand, if the Federal Reserve keeps the interest rate the same, the inflation rate will continue to rise.
How did we get here?
Money printing has been going since 1971 when the US moved away from the gold standard. Then in 2020, the fed went on overdrive as it attempts to stimulate the economy due to the pandemic lockdown. The U.S. government issued stimulus checks to millions of employed Americans. Where did the money come from? The government had to borrow by selling its debt in the form of U.S. Treasury bonds and other types of securities. After the bonds are sold, the Federal Reserve gets to work and starts printing money.
What is so ironic about this number is that just two years ago, Federal Reserve reported that 40% of Americans don’t have $400 in the bank for emergency expenses, according to a report from ABC News. The 2019 Federal Reserve survey finds that almost 40% of American adults wouldn’t be able to cover a $400 emergency with cash, savings, or a credit card charge.
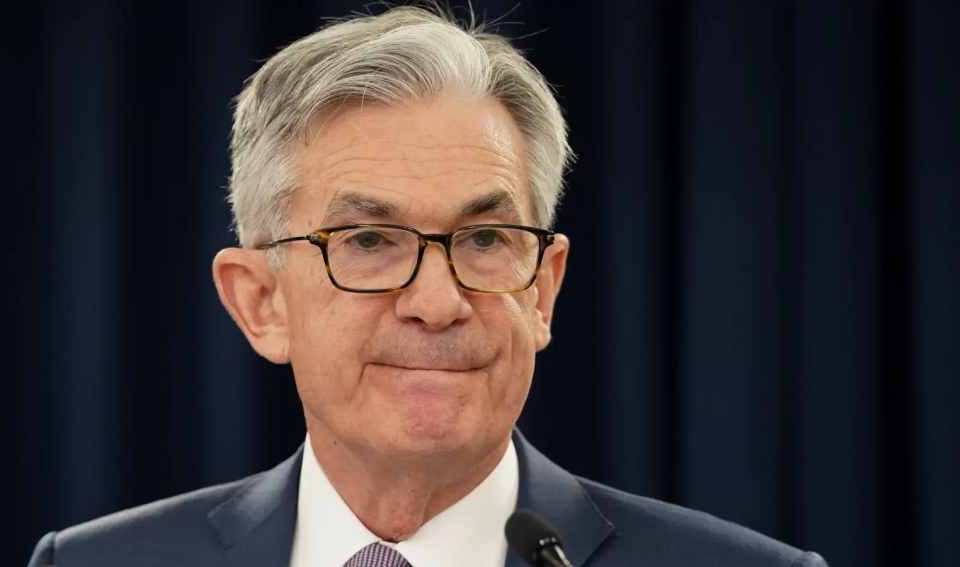
Below is a video of the Federal Reserve Chairman Jerome Powell admitting the government simply flooded the system with money.
Money printing is nothing new. The Federal Reserve has been printing money since 1971 when the United States moved away from the gold standard and President Nixon ended the convertibility of U.S. dollars to gold.
On Aug. 15, 1971, Former President Richard Nixon said in a speech, “I have directed [Treasury] Secretary Connally to suspend temporarily the convertibility of the dollar into gold or other reserve assets, except in amounts and conditions determined to be in the interest of monetary stability and in the best interests of the United States.”
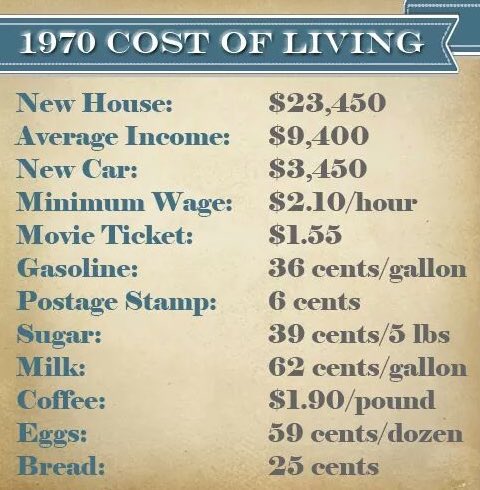
In 1970, the average income was $9,400 and a new house was $23,400. Today, the cost of an average home is over $200,000.

Is Federal Reserve repeating the same mistakes of 1921 Weimar Germany?
So if history is any guide, what the Federal Reserve is doing now has been tried throughout history. As Federal Reserve continues to print trillions of dollars out of thin air with no productivity to back it up, at some point down the road, the world will finally lose faith in the US dollar as a global currency and conclude that it no longer makes sense to store their wealth in US dollars.
Today, the Federal Reserve appears to be following in the footsteps of 1923 Germany’s Weimar Republic shortly after World War I. The country has often been cited as a classic of unending money printing. Between June 1921 and November 1923, the highest monthly inflation rate rose by over 30,000% in Weimar Germany.
It all started around 1921 when Germany stopped backing its currency with gold and instead fired up its money-printing machine (similar to what the Federal Reserve is doing today) in order to finance the war. Then the money-printing machines continued printing after the war to help pay for reparations imposed upon Germany by the Allies.
Interestingly, before World War I the German mark was trading at a value of roughly five to the dollar. Less than ten years later, it took one trillion German marks to buy a single dollar — which isn’t surprising considering that in 1923 the Reichsbank was issuing 120,000 trillion marks per day.
In addition, before hyperinflation came to the Weimar Republic, the typical household spent 30% of their income on food and 30% on housing. By the time hyperinflation peaked in 1923, food expenses consumed 91% of German household income, while housing expenses fell to just 0.2%.

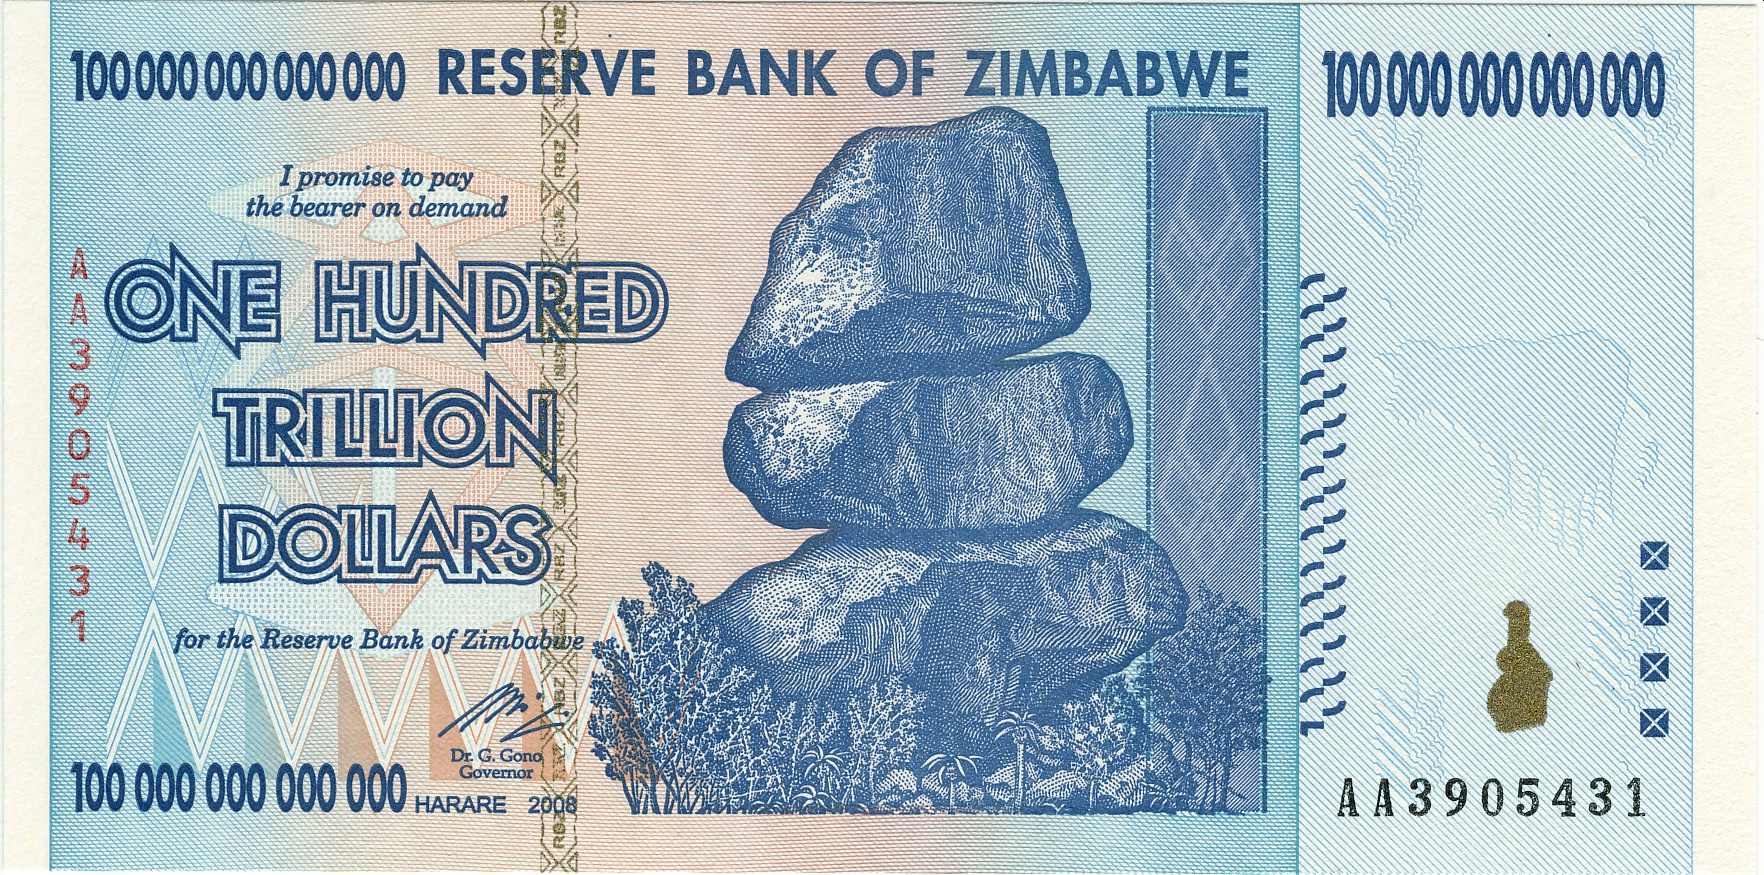
Zimbabwe is another country with hyperinflation. The African country of Zimbabwe experienced hyperinflation between 2006 and 2009. How bad was it? During the month of March 2007 the inflation rate there was 1730%. To put that in perspective, a $2 loaf of bread on March 1st would have cost $36.60 on the first day of April.
Germany and Zimbabwe are not alone. Venezuela is the most recent example. However, there are other hyperinflation events that affected Argentina and Brazil in 1989, Russia in 1992, and Yugoslavia in 1994. In the video below, our friend Jake Tran takes us on a journey through the history of countries that have tried to print their way out of the economic crisis only to find themselves in deeper economic woes.
Jake also explained that the reason why we haven’t seen hyperinflation is that the amount of money being printed is only one of the factors that contribute to inflation. To get major inflation, Jake explains, we need:
1. Industrial Output: How much “stuff” an economy makes
2. Employment: Too much employment leads to employers fighting over workers, which leads to higher wages, which leads to higher prices
3. The Money Supply: More money when an economy is producing the same amount or less stuff equals higher prices
4. Velocity of Money: If money is exchanging hands, and if so, how fast is it exchanging hands.
Hats off to Jake for putting this video together. Enjoy!

