This is what California’s wildfires look like from space

California’s wildfires, which started on August 19, 2020, continue with no end in sight. California firefighters continue to battle the unprecedented blazes but staffing shortages have made it difficult to contain the fire. “Fire season is lasting longer. Fires are getting bigger. We need more people,” firefighters pleaded to California Governor Gavin Newsom.
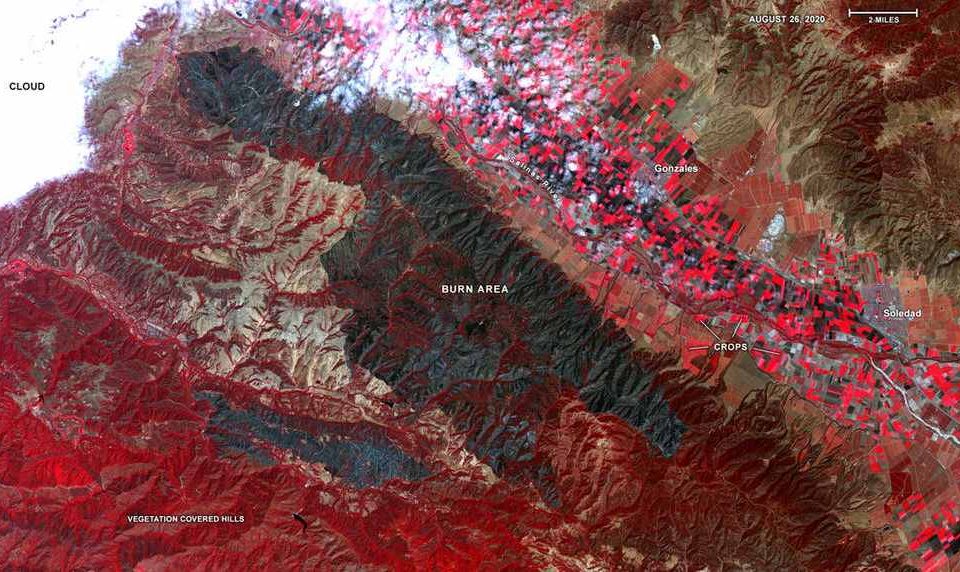
You may be wondering how massive are the wildfires torching Southern California. According to NASA, the smoke from the blazes is clearly visible from 438 miles above the Earth. NASA’s Terra satellite captured by the ASTER instrument aboard NASA’s Terra satellite. In the featured image above, the false-color map shows the burn area of the River and Carmel fires in Monterey County, California. Vegetation (including crops) is shown in red; the burn area (dark blue/gray) is in the center of the image.
As California experiences one of the worst wildfire seasons on record, NASA is leveraging its resources to help. Scientists supporting the agency’s Applied Sciences Disaster Program in the Earth Sciences Division are generating maps and other data products that track active fires and their smoke plumes while also identifying areas that may be susceptible to future risks.
“When disasters like this occur, we are able to swiftly respond to requests from our partners who need images and mapping data,” said David Green, manager of the Disasters Program at NASA Headquarters in Washington. “Likewise, in the aftermath of the fires, our researchers will use orbital and aerial data of the burn areas to help mitigate hazards such as landslides and mudslides.”
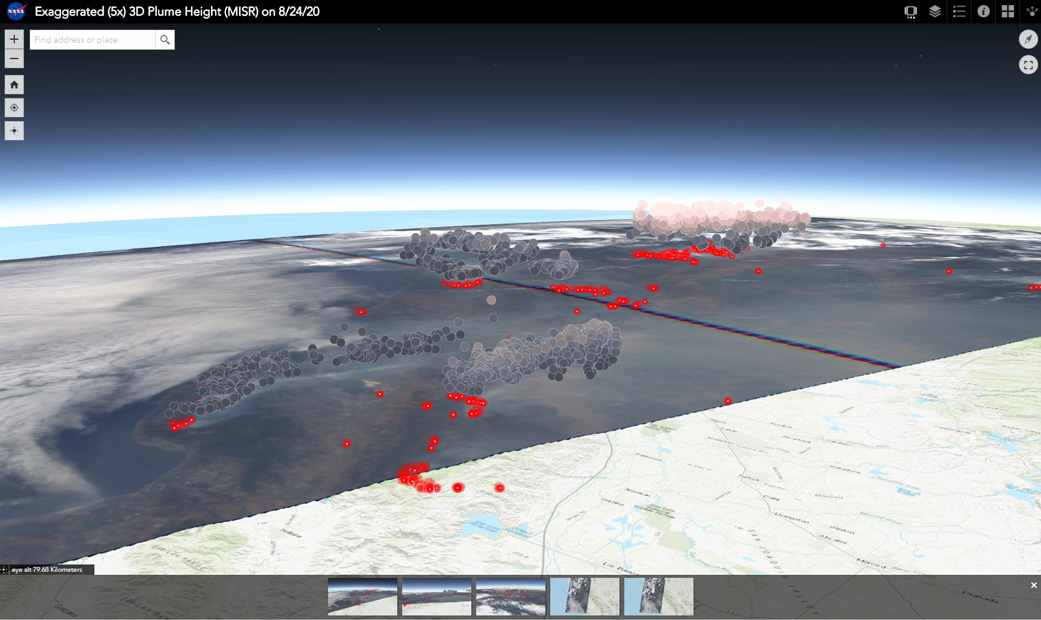
The screenshot below is an interactive 3D visualization that allows you to explore the height of smoke plumes from the California fires, using data from the Multi-angle Imaging SpectroRadiometer (MISR) instrument aboard NASA’s Terra satellite.

Most of the data come from the numerous satellite instruments that pass over the state, such as the MOderate Resolution Imaging Spectroradiometer (MODIS) instruments aboard the Aqua and Terra satellites, the Visible Infrared Imaging Radiometer Suite (VIIRS) instruments aboard the Suomi-NPP satellite, and the Cloud-Aerosol Lidar with Orthogonal Polarization (CALIOP) instrument onboard the CALIPSO satellite.
Another such instrument is the Advanced Spaceborne Thermal Emission and Reflection Radiometer (ASTER) instrument aboard the Terra satellite. Managed by Japan Space Systems and NASA’s Jet Propulsion Laboratory in Southern California, ASTER views Earth’s surface in visible, near-infrared, and thermal-infrared wavelengths, allowing features such as the smoke and heat of fires to be identified and mapped. Such orbital data help firefighting agencies to better locate fires and direct crews there.
The Multi-angle Imaging SpectroRadiometer (MISR), another JPL-managed instrument aboard Terra, is being used to better understand how high and far the smoke particles travel. MISR data were also used to detect the amount and type of smoke particles within smoke plumes, using the MISR Research Aerosol retrieval algorithm developed by researchers at NASA’s Goddard Space Flight Center in Greenbelt, Maryland.
The smoke plumes generated by the California fires have traveled across vast swaths of western North America in recent weeks, affecting air quality and visibility. Airborne smoke particles can increase the risk of cardiovascular and respiratory disease when inhaled, so tracking their spread provides valuable information for local public health officials.
Researchers from NASA JPL and GSFC were instrumental in analyzing the satellite data, and the NASA Disasters Program and NASA Health and Air Quality Applied Sciences Team coordinated directly with stakeholders from the California National Guard to aid in tracking the impacts of the fires.
“We will also fly our short wavelength infrared imager looking in the same direction as UAVSAR, which will see the fire through the smoke,” said Andrea Donnellan, a principal research scientist at JPL. “These combined data can help us better understand how these active fires are affecting the area.”
You can read more at NASA.gov.

