Data shows daily coronavirus deaths are decreasing worldwide. Media misleads with cumulative statistics and graphs

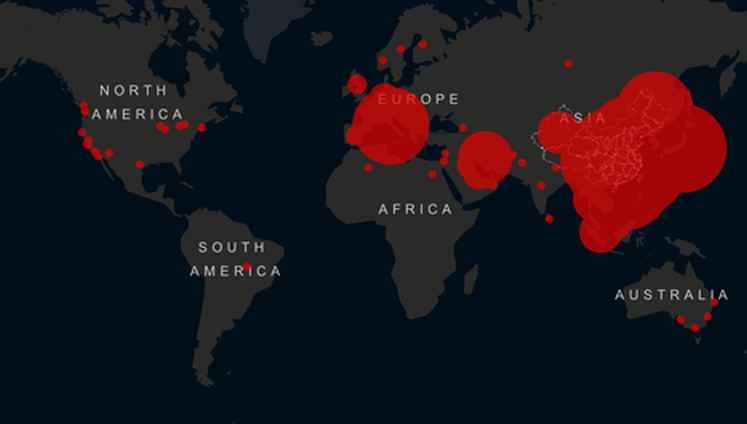
With coronavirus death toll in the U.S. rising to 19, people are becoming increasing afraid of contracting the disease. To date, there are 3,803 reported deaths with 109,835 confirmed cases worldwide. Also a total of 60,694 people have recovered from the virus. As the fear of coronavirus continues to spread, there are a growing number of reports of empty shop shelves as people rush to stock up on basic products such as hand soap, sanitizers, tissue papers, and many more. It got so bad that some stores are now limiting purchases of these products, more due to coronavirus fears.
The fears stem from the misleading information coming from mainstream media about the trend of the virus. The media shows the number of fatalities continuously increasing, on a time-based graph. The problem with this is that, the media only uses a cumulative graph to illustrate coronavirus deaths. However, if you look deeper at the raw data provided by John Hopkins on GITHUB, the number of global deaths per day are decreasing worldwide.
Hats off to Evan at TradeGuru, who first noticed the discrepancy in media’s cumulative statistics and created a more accurate chart. According to Evan’s analysis using the raw data provided by John Hopkins University, “the virus is decreasing in hotspots such as South Korea, China and Hong Kong (the first to deal with the novel virus). The press tells us it’s an outbreak, or a pandemic on the precipice. Both situations would suggest exponential growth. The actual data doesn’t suggest exponential growth of fatalities at all. The data suggests decline. In fact, the crude death rate is statistically 0.”
Also, it’s now being estimated that 80% of individuals that contract the coronavirus are asymptomatic or midly-symptomatic. And in this viral video, Rebecca Fraiser says she “never really felt unwell” after contracting the virus, and it “sounds like it is the case for the majority of people.”
GRAPH: Number of COVID-19 Deaths Per Day by Country from January 22nd to March 7th — Daily Totals Stacked To Show Worldwide Total


- • Open Full Interactive Graph – double click countries on chart to highlight (works on desktop browsers only).
- • Full data table
- • Download the raw data from John Hopkins GITHUB.
| Date | Location | Reported Deaths |
| 1/22/2020 | Worldwide | 17 |
| 1/23/2020 | Worldwide | 1 |
| 1/24/2020 | Worldwide | 8 |
| 1/25/2020 | Worldwide | 16 |
| 1/26/2020 | Worldwide | 14 |
| 1/27/2020 | Worldwide | 26 |
| 1/28/2020 | Worldwide | 49 |
| 1/29/2020 | Worldwide | 2 |
| 1/30/2020 | Worldwide | 38 |
| 1/31/2020 | Worldwide | 42 |
| 2/1/2020 | Worldwide | 46 |
| 2/2/2020 | Worldwide | 103 |
| 2/3/2020 | Worldwide | 64 |
| 2/4/2020 | Worldwide | 66 |
| 2/5/2020 | Worldwide | 72 |
| 2/6/2020 | Worldwide | 70 |
| 2/7/2020 | Worldwide | 85 |
| 2/8/2020 | Worldwide | 87 |
| 2/9/2020 | Worldwide | 100 |
| 2/10/2020 | Worldwide | 107 |
| 2/11/2020 | Worldwide | 100 |
| 2/12/2020 | Worldwide | 5 |
| 2/13/2020 | Worldwide Climax | 253 Coronavirus Deaths vs. Estimated 794 to 1,780 from the Seasonal Flu on 2/13. |
| 2/14/2020 | Worldwide | 152 |
| 2/15/2020 | Worldwide | 143 |
| 2/16/2020 | Worldwide | 104 |
| 2/17/2020 | Worldwide | 98 |
| 2/18/2020 | Worldwide | 139 |
| 2/19/2020 | Worldwide | 115 |
| 2/20/2020 | Worldwide | 125 |
| 2/21/2020 | Worldwide | 4 |
| 2/22/2020 | Worldwide | 207 |
| 2/23/2020 | Worldwide | 11 |
| 2/24/2020 | Worldwide | 160 |
| 2/25/2020 | Worldwide | 79 |
| 2/26/2020 | Worldwide | 62 |
| 2/27/2020 | Worldwide | 44 |
| 2/27/2020 | Worldwide | 58 |
| 2/29/2020 | Worldwide | 69 |
| 3/1/2020 | Worldwide | 55 |
| 3/2/2020 | Worldwide | 89 |
| 3/3/2020 | Worldwide | 75 |
| 3/4/2020 | Worldwide | 94 |
| 3/5/2020 | Worldwide | 94 |
| 3/6/2020 | Worldwide | 112 |
| 3/7/2020 | Worldwide | 98 |


