What Percentage of Indie Hacker Products Make $100K in ARR?
 Daniel Levi
Posted On September 28, 2026

Indie hacker success stories are everywhere. A solo founder launches an AI tool over a weekend. A bootstrapped SaaS crosses $10,000 in monthly recurring revenue. Someone posts a Stripe screenshot showing six figures in annual revenue, followed by a thread explaining how they did it.
The numbers tell a much harsher story.
An analysis of 10,150 products listed on TrustMRR published on GitHub suggests that just 2.4% had sufficiently fresh monthly recurring revenue at or above the $100,000 ARR mark as of September 2026. Put another way, roughly one in 41 products in the dataset had crossed that threshold.
That number comes from one of the largest recent public datasets of independently built products with verified revenue. TrustMRR connects directly to payment providers such as Stripe and tracks revenue reported by thousands of products. Researcher Mifanr pulled all 10,150 products listed on the platform on September 4, 2026, and published the underlying anonymized data and methodology.
Analyzing Percentage of Indie Hackers Making $10K MRR with Verified Revenue
Our analysis of that dataset found 272 products reporting at least $8,333.33 in MRR, the monthly run rate needed to reach $100,000 ARR. Twenty-seven of those qualifying records had expired connections or had not synced for more than 30 days. Removing them left 245 products with sufficiently fresh reported MRR, or 2.41% of the 10,150 products in the dataset.

What is the benchmark? → $8,333 MRR = $100K ARR.
That does not mean 97.6% of indie hacker products fail.
TrustMRR is a self-selected population of founders willing to publicly connect and display their revenue. Products that disappeared before the platform existed may never appear in the dataset. Products are at different ages and stages. Some make money through one-time purchases, marketplaces, usage fees, templates, or other models that MRR does not fully capture. The data is a snapshot, not a longitudinal study following every indie product from launch to death.
Still, the numbers offer a rare look behind the revenue screenshots that dominate founder communities.
The picture that emerges is striking. 26.1% of the products in the TrustMRR dataset had never recorded a payment through their connected payment channels. Just 49.1% had generated revenue during the previous 30 days. Among the 4,987 products that did bring in money during that period, median revenue was only $169. The top 1% of products captured 76.1% of all revenue generated across the platform during those 30 days.
That concentration raises a bigger question about the indie hacker boom.
AI coding tools, no-code platforms, cloud infrastructure, payment services, and cheap software distribution have made it easier than ever for one person to launch a product. Yet making software easier to build does not automatically make customers easier to find.
For decades, entrepreneurs have heard variations of another grim statistic: a staggering 90% of startups fail. The exact percentage is far less settled than the internet often suggests, and startup survival is a different measurement from reaching $100,000 in recurring revenue. A small business earning $40,000 a year has not necessarily failed simply because it never reaches six figures in ARR.
That distinction matters.
The more revealing question may no longer be how many people can build a software product. AI is pushing that number higher every day.
The question is how many can build one that becomes a meaningful business.
The latest data suggests that far fewer indie hacker products reach meaningful revenue than the success stories filling our feeds might lead us to believe.
Only 2.4% of indie hacker products make $100K ARR, with an important caveat
Reaching $100,000 in ARR requires roughly $8,333.33 in monthly recurring revenue.
In the September 2026 TrustMRR dataset, 272 of the 10,150 listed products reported MRR at or above that level. That works out to 2.68%.
Credit: Mifanr
However, you can’t take that number at face value.
A separate freshness audit examined the highest-earning records and found that some were no longer reliably up to date. Among the products meeting the $100,000 ARR threshold, 27 had an expired payment connection or had not synced their revenue data for more than 30 days.
Removing those 27 records from the qualifying group leaves 245 products with sufficiently fresh MRR of at least $8,333.33 per month.
That gives us:
245 ÷ 10,150 = 2.41%
Or roughly one out of every 41 products listed on TrustMRR.
Indie Hacker Product Revenue by Category
According to Mifanr’s research, category comparisons come with some noise since founders classify their own products. Still, the differences are striking. Productivity and Utilities account for 894 products combined, yet just five report MRR above $5,000. Mobile Apps stand out among the larger categories: 69% of the 474 products are earning revenue, and 8% have crossed $5,000 in MRR. That apparent advantage needs context. Most mobile apps on TrustMRR connect through RevenueCat, and setting up RevenueCat typically means an app already has paying users. In other words, some of the category’s stronger performance may reflect who makes it into the dataset in the first place, rather than mobile apps having inherently better odds of success.
| Category | Products | Never earned | Earning | mrr ≥ 5k | 30d ≥ 5k |
|---|---|---|---|---|---|
| Mobile Apps | 474 | 14.8% | 69.0% | 8.0% | 9.3% |
| E-commerce | 201 | 20.9% | 53.2% | 6.0% | 10.9% |
| Marketing | 612 | 24.0% | 54.2% | 4.9% | 7.0% |
| Artificial Intelligence | 2,156 | 19.8% | 51.5% | 4.2% | 4.8% |
| SaaS | 951 | 30.2% | 43.3% | 3.7% | 4.2% |
| Education | 383 | 17.2% | 56.7% | 3.7% | 7.0% |
| Health & Fitness | 358 | 16.8% | 64.5% | 3.4% | 4.7% |
| Developer Tools | 581 | 27.7% | 42.9% | 2.1% | 3.3% |
| Productivity | 691 | 26.0% | 47.3% | 0.6% | 1.6% |
| Utilities | 203 | 23.6% | 55.2% | 0.5% | 2.5% |
Indie Hacker Product Revenue by Country
Geography reveals another interesting pattern, but the data needs careful interpretation. TrustMRR records the country where a product’s payment entity is registered, **not the founder’s nationality or necessarily the market where its customers are located**.
That distinction matters especially for China. Stripe is not available to businesses based in mainland China, so Chinese developers may collect payments through entities registered in places such as Hong Kong, Singapore, or the United States. Only 11 products in the dataset were tagged to mainland China and 17 to Japan. Mifanr separately identified 55 records containing Chinese characters in the founder name or product description. Of those, 52.7% were earning revenue, and three reported MRR above $5,000, a sample far too small to support broader conclusions.
The United States showed a much clearer difference. Products tied to U.S. payment entities reached **$5,000 in MRR at nearly twice the platform-wide rate**, and revenue-generating products in that group had the highest median 30-day receipts. Yet the data cannot tell us whether that advantage comes from being incorporated in the United States, selling primarily to U.S. customers, differences in product mix, or some combination of those factors. The country figures show a correlation, not an explanation.
| Country of payment entity | Products | Never earned | Earning | mrr ≥ 5k | 30d ≥ 5k | Median 30d, earners |
|---|---|---|---|---|---|---|
| United States | 1,916 | 18.7% | 57.7% | 7.4% | 10.3% | $331 |
| Singapore | 79 | 22.8% | 63.3% | 6.3% | 12.7% | $221 |
| Canada | 281 | 21.4% | 52.3% | 5.3% | 6.4% | $249 |
| France | 712 | 24.2% | 50.6% | 5.1% | 5.5% | $218 |
| United Kingdom | 673 | 25.1% | 49.5% | 2.5% | 3.4% | $190 |
| Germany | 274 | 25.2% | 42.7% | 1.8% | 4.7% | $141 |
| Hong Kong | 135 | 23.7% | 50.4% | 1.5% | 3.0% | $71 |
| India | 933 | 40.9% | 33.2% | 0.5% | 1.3% | $67 |
| Not specified | 2,238 | 28.1% | 52.9% | 4.1% | 5.4% | $138 |
The denominator stays at 10,150. A stale record doesn’t prove a product stopped earning money, so treating those products as confirmed failures would introduce another assumption. Instead, we remove the 27 stale qualifying records from the numerator because we can’t confirm their current MRR.
This distinction is more than statistical housekeeping. Revenue leaderboards can preserve old numbers long after a payment connection stops syncing. The TrustMRR census found that stale records were disproportionately concentrated near the top of the leaderboard. Of 390 records initially showing more than $5,000 in MRR, 37 were expired or had not synced for more than 30 days. Those 37 records represented 37.4% of the platform’s reported MRR at the time.
So 2.4% is our best estimate from this dataset, not a universal indie hacker success rate.
TrustMRR did not randomly select 10,150 products from every indie product ever launched. Founders choose to list their businesses and publish their revenue. The platform itself launched in October 2025, meaning countless products that launched and disappeared years earlier are absent. Successful founders may have more reason to display their numbers than founders whose products never found customers.
The dataset has another limitation that matters for this question: MRR measures subscriptions.
An indie hacker selling a $199 template, charging customers by API usage, taking marketplace commissions, or selling lifetime licenses can build a meaningful business and still report little or no MRR. In fact, the TrustMRR census found that 1,222 of the 4,987 products earning money during the previous 30 days had zero subscription revenue.
That means the 2.4% figure answers a narrow question remarkably well:
What share of the 10,150 products listed in this September 2026 TrustMRR snapshot had sufficiently fresh subscription MRR consistent with at least $100,000 ARR?
About 2.4%.
It cannot tell us the lifetime probability that a new indie hacker product launched today will eventually reach $100,000 ARR. No dataset we found can answer that question with comparable precision.
That caveat matters most when we compare the new finding with the statistic that has circulated through indie hacker communities for years: 5%.
Where the “5% of indie hacker products make $100K ARR” statistic came from
Before the 2.4% figure, there was 5%.
That number has circulated through indie hacker communities for years and traces back to a July 2022 analysis by Scraping Fish, which examined revenue data from 937 products listed on Indie Hackers.
The dataset had one major advantage: the revenue figures were Stripe-verified rather than survey estimates.
Scraping Fish research found that roughly 5% of the 937 products were generating more than $8,333 per month, the monthly equivalent of $100,000 per year. That finding helped produce a striking shorthand for indie entrepreneurship: only around 5% of indie hacker products make more than $100,000 a year.
Credit: Scraping Fish
A subtle problem arises when you turn that finding into an ARR statistic.
Monthly revenue and monthly recurring revenue are not necessarily the same thing.
A SaaS company collecting $10,000 every month from subscriptions clearly has recurring revenue. A founder who sells $10,000 worth of lifetime licenses, templates, courses, or one-time software purchases during a particular month has $10,000 in monthly revenue too, but annualizing that month does not automatically give the business $120,000 in ARR.
The 2022 Scraping Fish study established that roughly 5% of the products crossed the monthly revenue threshold. It did not establish that every dollar qualifying those products was recurring subscription revenue.
That distinction has become more relevant as indie businesses have spread beyond conventional SaaS.
The newer TrustMRR census shows just how much money can disappear when the analysis looks exclusively at MRR. Across the platform, receipts during the previous 30 days were 2.08 times the sum of reported MRR. Even after removing Gumroad, an unusually large business in the dataset, the ratio remained 1.69. The researcher calculated that 40.7% of the money represented on the platform came from outside subscription revenue.
So does the newer 2.4% figure mean the indie hacker success rate has fallen by half since 2022?
No. The available data does not support that conclusion.
The two studies examine different populations at different times, using measurements that aren’t perfectly interchangeable.
Scraping Fish analyzed 937 products listed on Indie Hackers in 2022. The newer calculation comes from 10,150 products listed on TrustMRR in September 2026. Both platforms depend on founders choosing to publicly expose revenue information. Neither represents a random sample of every independently built software product.
Another problem is comparing percentages across time. TrustMRR launched on October 31, 2025. More than a third of the products in the September 2026 dataset were founded before the platform existed. A successful product launched in 2021 can join TrustMRR years later. A product launched in 2021 that shut down after six months may never appear there at all.
That creates survivorship bias in hard-to-measure ways.
The safest conclusion is much narrower.
In 2022, an analysis of 937 Stripe-verified Indie Hackers products found that roughly 5% generated monthly revenue above the equivalent of $100,000 per year.
Four years later, our analysis of the much larger TrustMRR dataset found that roughly 2.4% of its 10,150 listed products had sufficiently fresh subscription MRR consistent with at least $100,000 ARR.
Those are two useful snapshots.
They don’t show that an indie hacker’s odds of reaching $100,000 ARR fell from 5% to 2.4%.
The larger 2026 dataset can tell us much more than that comparison. It shows what happens to thousands of products before they ever get anywhere near six figures.
What 10,150 indie hacker products tell us about making money
The $100,000 ARR threshold tells us who made it near the top. The rest of the TrustMRR dataset shows how difficult the climb can be.
Of the 10,150 products analyzed, 2,654, or 26.1%, had never recorded any revenue across the three revenue fields available in the dataset. Another 2,417 had earned money at some point but recorded no receipts during the previous 30 days.
Just 4,987 products, or 49.1% of the dataset, generated revenue in the previous 30 days.
That might sound encouraging at first. Nearly half were making money.
Then you look at how much.
Among those 4,987 products currently earning, the median revenue in the previous 30 days was just $169.
That figure puts the founder success stories you see on X, Reddit, Indie Hackers, and other online communities into perspective. A product generating $10,000 or $20,000 a month makes for a compelling post. A product bringing in $169 does not.
The distribution gets even more lopsided at the top.
The top 1% of all 10,150 products, just 102 businesses, captured 76.1% of all revenue generated on the platform during the previous 30 days.
That is an extraordinary concentration of revenue.
It means the typical indie product in this dataset looks very different from the businesses that dominate founder conversations online. The middle is surprisingly thin. Thousands of products make little or nothing, followed by a relatively small group that captures a huge share of the money.
The data gets more interesting when product age comes into play.
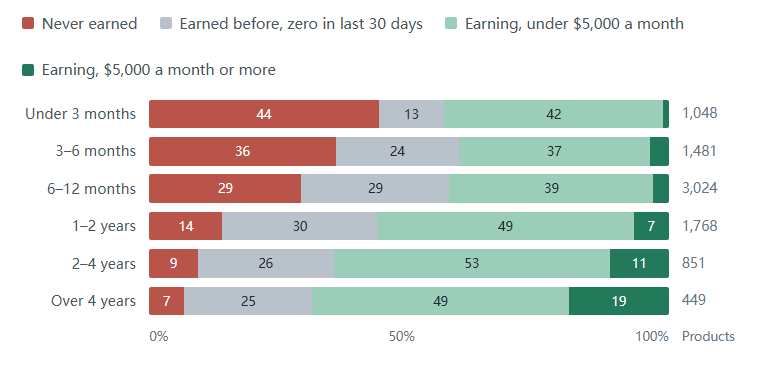
Among products younger than three months, 44% had never earned anything. Just 1% were making at least $5,000 per month. For products between three and six months old, 36% had never earned, and the share making $5,000 or more per month rose to 3.6%.
Products between one and two years old looked very different. Only 14% had never earned, and 7% were making at least $5,000 per month. Among products more than four years old, 7% had never earned, and 19% were generating at least $5,000 per month.
Those numbers can easily be misread.
They do not mean that keeping a struggling product alive for four years gives it a 19% chance of reaching $5,000 MRR. Older products on TrustMRR are survivors. Products that failed years earlier may never have joined the platform, particularly since TrustMRR itself did not launch until October 2025.
The researcher behind the census explicitly warns against interpreting those age groups as probabilities of success.
Still, the age data reveals something useful about the products that did reach meaningful revenue.
The 353 products with fresh MRR above $5,000 had a median age of 18.2 months. Nearly four in ten were more than two years old. Their median number of active subscriptions was 388, and their median monthly subscription price was $37, compared with $13 across all products on the platform with subscriptions.
Another uncomfortable finding is buried in the data.
Reaching $5,000 MRR did not mean a product was still growing. Among those 353 businesses, 35.3% had negative MRR growth during the previous 30 days, and median MRR growth across the group was zero.
Getting there is one problem.
Staying there is another.
That matters in an era when building software has become dramatically cheaper and faster. AI coding assistants can help a solo developer turn an idea into a working product in days. You can add payment infrastructure in hours. Cloud hosting can start for almost nothing. A founder can launch globally without hiring a sales team, renting an office, or raising venture capital.
None of that guarantees distribution.
The TrustMRR numbers suggest that shipping the product may increasingly be the easy part. Finding enough people willing to pay for it, keeping them as customers, and doing that month after month remain much harder problems.
And that brings us to the comparison hanging over almost every discussion of entrepreneurial success: the famous claim that roughly nine out of ten startups fail.
How does the 2.4% indie hacker figure compare with the startup failure rate?
If 2.4% sounds brutal, consider one of the most repeated statistics in entrepreneurship: roughly 90% of startups fail. Variations put the figure at 91%.
A direct comparison is tricky. The widely repeated 90% or 91% figure doesn’t match how the U.S. government measures business survival.
The latest data published by the U.S. Small Business Administration’s Office of Advocacy paints a less dramatic, but still sobering, picture. From 1994 through 2022, an average of 67.7% of new employer establishments survived at least two years, 49.2% survived five years, 33.9% survived ten years, and 25.5% survived fifteen years. The figures are based on Business Employment Dynamics data.
That means roughly half of new employer establishments are gone by year five and about two-thirds are gone by year ten. It does not support the blanket claim that 90% of new businesses fail.
There is a deeper issue with comparing those numbers with indie hackers.
Business survival and reaching $100,000 ARR measure two completely different outcomes.
A bootstrapped software product earning $3,000 a month after four years has not failed. It may provide its founder with useful income and continue operating for years. It simply has not reached $100,000 ARR.
The reverse can happen too. A product can cross $100,000 ARR and later shrink, get sold, or shut down.
That makes the 2.4% TrustMRR finding a measure of revenue attainment at a particular point in time, not failure.
The distinction gets lost easily when startup statistics spread online. “Failure” can mean shutting down, failing to return venture capital, never reaching product-market fit, becoming unprofitable, selling below investors’ expectations, or simply failing to reach a founder’s original goal. Those outcomes are not interchangeable.
The SBA data uses a much cleaner test: did the employer establishment survive?
By that measure, the entrepreneurial picture is harsh, but nowhere near as simple as the viral “nine out of ten fail” line suggests. About half survive five years. Roughly one-third make it to ten.
The TrustMRR data asks a harder financial question.
How many products have built enough recurring subscription revenue to reach a six-figure annual run rate?
For the September 2026 snapshot, our answer is about 2.4%.
That does not make the other 97.6% failures.
Some are young. Some generate meaningful non-subscription revenue. Some may eventually cross $100,000 ARR. Some are deliberately small side businesses. Others may have already peaked and are declining. Thousands have made little or no money.
The TrustMRR census gives us a striking example of that last group. 2,654 products, or 26.1%, had never recorded a payment through the revenue fields analyzed. Another 2,417 had earned money before but reported no revenue during the previous 30 days.
Those numbers get closer to what people usually mean when they talk about products failing economically, yet they still cannot tell us whether those businesses are permanently dead.
The comparison reveals something more useful than another failure statistic.
Traditional startups face a survival problem.
Indie hackers face a revenue problem.
Cheap cloud infrastructure, Stripe, open-source software, no-code tools, and AI coding assistants have made it possible to keep a software product alive at costs that would have been difficult to picture two decades ago. A solo founder doesn’t need an office, a large payroll, or millions of dollars in venture funding to stay in business.
That changes what “failure” looks like.
A product can stay online for years and still make almost no money.
The TrustMRR data captures that strange middle ground. 72.9% of the products had earned something at some point, yet fewer than half had revenue during the previous 30 days, and the median among those current earners was just $169.
Survival, in other words, can be a very low bar for an internet business.
Reaching $100,000 ARR is a much higher one.
That may explain why the indie hacker economy can simultaneously produce thousands of active products, endless founder success stories, and a dataset in which only a small fraction sits above the six-figure recurring-revenue line.
The next question is why that small fraction can look so much larger from the outside.
Has AI improved the odds for indie hackers?
AI has changed what one person can build.
A solo founder can now use AI to write code, debug software, create landing pages, generate marketing copy, answer support questions, analyze customer feedback, and prototype ideas at a speed that once required a small team.
That has lowered the barrier to launching software. It has also produced an explosion of AI products.
Nearly half of the 10,150 products in Mifanr’s TrustMRR analysis were classified as AI-related using keywords in product names, descriptions, and categories. Using TrustMRR’s narrower self-reported category field, 21.2% fell under artificial intelligence.
Yet the revenue data shows little evidence that putting AI at the center of a product gives indie hackers better odds of making serious money.
Using the broader classification, 49.3% of AI products were earning revenue, compared with 49.0% of non-AI products.
| Age | Products | Never earned | Earning | mrr ≥ 5k | 30d ≥ 5k | |
|---|---|---|---|---|---|---|
| All | AI | 5,049 | 25.1% | 49.3% | 3.8% | 4.8% |
| Non-AI | 5,101 | 27.2% | 49.0% | 3.9% | 5.9% | |
| Under 12 months | AI | 2,959 | 33.2% | 41.6% | 1.7% | 2.4% |
| Non-AI | 2,602 | 34.6% | 42.4% | 1.8% | 3.0% | |
| 1–2 years | AI | 896 | 13.4% | 57.5% | 5.7% | 6.1% |
| Non-AI | 872 | 14.8% | 54.7% | 5.2% | 7.3% |
At $5,000 MRR, the difference went slightly in the opposite direction. 3.8% of AI products had reached that level, compared with 3.9% of non-AI products.
Among products younger than 12 months, 1.7% of AI products had reached $5,000 MRR, versus 1.8% for non-AI products. Among products one to two years old, AI products came out slightly ahead at 5.7%, compared with 5.2% for non-AI products.
None of those gaps is large enough to show a meaningful advantage for either group.
Revenue tells a similar story. Among products currently making money, median receipts during the previous 30 days were $161 for AI products and $175 for non-AI products.
That may be one of the more revealing findings in the entire dataset.
AI has changed the economics of building software. The TrustMRR data does not show that it has changed the economics of selling software to the same degree.
In some ways, lowering the barrier to creation may make the second problem harder.
If one founder can use AI to build a product in a weekend, thousands of other founders have access to many of the same models, coding assistants, APIs, cloud services, and distribution channels. Features that once took months of engineering can be copied much faster. New categories can fill with competitors almost as soon as demand becomes visible.
The bottleneck moves.
Writing the code becomes cheaper. Getting attention does not.
A founder still needs a problem customers care enough about to pay for, a way to reach those customers, pricing that works, retention, trust, and enough differentiation to keep competitors from turning the product into a commodity.
The TrustMRR data cannot tell us whether AI caused any of these outcomes. It cannot tell us whether a particular AI product would have earned more or less without AI, and its AI classification is based partly on keywords rather than a detailed examination of every product.
What it can tell us is simpler.
Across this dataset, AI products were no more likely than non-AI products to be earning revenue, and they were no more likely to have crossed $5,000 in MRR.
Mifanr summed up the finding succinctly: “In 2026, AI is the default setting for an indie product, much like ‘mobile’ a decade ago.”
That may capture the shift better than any revenue statistic.
AI can help almost anyone build.
It cannot make customers care.
Does building more products increase an indie hacker’s odds of success?
Indie hacker culture has long promoted a simple strategy: ship more products.
If one idea fails, build another. Each launch becomes another chance to find a market, another opportunity to learn distribution, and another shot at building something customers will pay for.
Analysis of TrustMRR data supports that strategy, but there is a catch.
Mifanr identified 5,697 unique founders through X handles attached to products in the dataset. Of those, 1,045 founders had two or more products listed on TrustMRR, covering 2,850 products in total. That made it possible to compare founders who had launched one product with those who had launched several.
The differences were substantial.
Among founders with one product, 50.5% had a product earning revenue, 12.9% had reached at least $1,000 per month, and 5.0% had reached at least $5,000 per month.
For founders with two or three products, 71.1% had at least one earning product, 18.8% had one generating at least $1,000 per month, and 8.6% had one generating at least $5,000.
Founders with four or more products posted the highest hit rates. Some 77.9% had at least one product making money, 31.3% had one generating at least $1,000 per month, and 14.1% had built at least one product generating $5,000 per month or more.
At first glance, the lesson seems obvious: build more products and your chances of finding a winner go up.
At the founder level, the dataset shows that.
At the product level, the picture changes.
A founder with four products has taken at least four shots at finding a winner. Mifanr points out that the 14.1% founder-level hit rate among people with four or more products works out to less than 3.5% per product if treated as four attempts, below the 5.0% figure for founders with a single product.
Another confounding factor is time.
Someone who has launched four, five, or ten products has probably been building businesses longer than someone on a first attempt. That founder may have accumulated years of experience in product development, pricing, marketing, distribution, customer support, and identifying markets worth pursuing. The dataset does not control for those differences.
Still, repeated attempts appear to matter at the founder level.
The data offers another clue. Among 243 identifiable founders with a product above $5,000 MRR, just 11, or 4.5%, had a second product above that threshold. Their other products were earning revenue 73% of the time, compared with a platform-wide baseline of 49%.
In other words, founders who had already built one successful product were more likely to have other products making money, but building one $5,000-MRR business rarely translated into building a second one at the same level.
The most prolific founders make the point even more clearly.
Among the 12 founders with the most products on TrustMRR, nine generated less than $1,000 across all their products in the previous 30 days. Three stood far apart from the group: Rohan Gilkes, Marc Lou, and Herman Palmgren, whose portfolios generated far more.
“Among the 12 founders with the most products on the board, 9 took in less than $1,000 across all their products in the last 30 days. The other three are Rohan Gilkes (9 products, $161,284), Marc Lou (17, $83,486), and Herman Palmgren (9 products, all earning, $57,357),” Mifanr wrote.
Shipping repeatedly may increase the chance that a founder eventually finds something that works.
It does not turn every launch into a better bet.
That distinction matters in an era when AI makes launching another product cheaper and faster than ever. A founder can now test more ideas with less engineering effort, but multiplying products does not automatically multiply demand.
The TrustMRR data points to a more nuanced lesson: more attempts can improve a founder’s chances of finding a winner, but successful products remain rare, including for people who keep shipping.
ARR doesn’t tell the whole indie hacker story
One more reason to be careful with the 2.4% figure: indie hackers don’t all make money through subscriptions.
ARR works beautifully for a conventional SaaS business charging customers every month or every year. It becomes much less useful for products selling lifetime licenses, templates, courses, API usage, marketplace services, digital downloads, or one-time purchases.
TrustMRR makes that distinction visible through separate revenue fields.
Its MRR figure tracks current subscription revenue. Its 30-day revenue figure tracks money actually received during the previous 30 days. Those numbers can tell very different stories.
Across the 10,150-product dataset, revenue received during the previous 30 days was 2.08 times the sum of reported MRR. Gumroad, which generated millions in 30-day revenue, has an outsized effect on that calculation. Remove Gumroad and the ratio was still 1.69. Mifanr calculated that 40.7% of the money represented on the platform came from outside subscription revenue after removing Gumroad.
The difference appears at the individual product level too.
Of the 4,987 products that generated revenue during the previous 30 days, 1,222 (24.5%) reported no subscription revenue. Another 1,295 products received more than one-fifth of their revenue from non-subscription sources. The median non-subscription share among earning products was 18%.
The effect remains visible among larger businesses.
TrustMRR contained 513 products generating more than $5,000 in total revenue during the previous 30 days. Of those, 85 had no subscription revenue, and 60 were generating more than $10,000 per month.
Those businesses would effectively disappear from an MRR-only ranking.
One example from the research makes the problem clear.
ShipFast, Marc Lou’s pay-once Next.js boilerplate, showed more than $1.27 million in lifetime revenue in the dataset but an MRR of zero. Gumroad showed more than $7.14 million in revenue during the previous 30 days and an MRR of zero. An analysis that treated zero MRR as zero revenue would classify both alongside products that had never made a cent.
That is why the claim that 58% of TrustMRR products “make no money” is misleading.
The arithmetic is straightforward: 5,930 of the 10,150 products had zero MRR, or 58.4%. But MRR measures subscriptions, not total revenue. Of those zero-MRR products, 1,222 had received money during the previous 30 days. Only 2,654 products, or 26.1%, had zero MRR, zero 30-day revenue, and zero lifetime revenue.
That distinction matters for our $100,000 ARR question too.
A product generating $15,000 every month from one-time purchases may have built a substantial business, but it does not have $180,000 ARR. Calling it a $180,000-ARR business would turn non-recurring sales into recurring revenue.
For the same reason, a product that does not reach $100,000 ARR should not automatically be counted as an unsuccessful indie business.
Some founders deliberately prefer one-time pricing. Others combine subscriptions with usage fees or digital products. Some run marketplaces and collect transaction fees. Some may generate more than $100,000 a year without having $100,000 in annual recurring revenue.
Our 2.4% figure should be read for exactly what it measures: the share of products in the September 2026 TrustMRR dataset with sufficiently fresh subscription MRR consistent with a $100,000 annual recurring revenue run rate.
It is not the percentage of indie hacker products that make $100,000 in total annual revenue.
And it is certainly not the percentage that succeeds.
So, what percentage of indie hacker products make $100K ARR?
The best recent public data we found puts the answer at about 2.4%.
Our analysis of the September 2026 TrustMRR dataset found 245 products with sufficiently fresh MRR of at least $8,333.33 per month, the recurring revenue run rate needed to cross $100,000 ARR.
That works out to roughly one in 41 of the 10,150 products listed on the platform.
The older 5% figure remains useful historical context. Scraping Fish found in 2022 that roughly 5% of 937 Stripe-verified products listed on Indie Hackers were generating more than $8,333 per month. You shouldn’t treat these two figures as evidence that indie hacker success rates have fallen by half. They come from different platforms, populations, periods, and measurements that aren’t perfectly comparable.
Nor does the newer figure mean 97.6% of indie hacker products fail.
Some products make substantial money outside subscriptions. Some are young and still growing. Some were built as side projects rather than attempts to create large companies. Some founders may be perfectly happy with $2,000 or $5,000 a month. TrustMRR itself is a self-selected platform, so its 10,150 products cannot represent every indie product ever launched.
What the dataset does provide is a rare view of how revenue is distributed across thousands of independently built products.
And that view is hard to mistake.
More than a quarter of the products had never recorded a payment through the revenue fields examined. Fewer than half had generated revenue during the previous 30 days. Among those that had, median 30-day revenue was only $169. The top 1% captured more than three-quarters of the platform’s revenue.
AI does not appear to have erased that divide. AI products and non-AI products in the dataset posted remarkably similar revenue outcomes. Building more products increased the chance that a founder had at least one winner, yet successful products remained uncommon across repeated attempts.
That points to a larger shift across software entrepreneurship.
For years, building the product was one of the biggest barriers to starting a software company. You needed technical skills, engineering time, infrastructure, or enough money to hire people who had them.
AI is tearing down much of that barrier.
One person can now create in weeks what might once have taken a small team months. The number of products people can build is rising. The cost of testing an idea is falling. Launching software has never been more accessible.
But customers have not become easier to acquire.
Attention remains scarce. Distribution remains difficult. Customers still need a reason to pay. They still cancel products they no longer need. Competitors can use the same AI tools to build similar features. A product still has to solve a problem people care about enough to pay for.
That may be the most important lesson buried inside these 10,150 products.
AI has made it dramatically easier to build a product. The data suggests it hasn’t made building a business dramatically easier.