Bitcoin drops to $77,091 for first time since April 2025 as crypto selloff erases $1 trillion in value

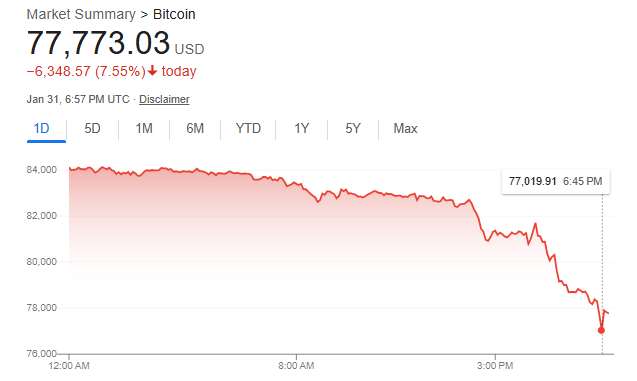
Bitcoin slipped to $77,091, its lowest level since April 2025, shaking confidence across crypto markets and triggering one of the sharpest pullbacks in months. The move dragged the broader market lower and erased more than $1 trillion in total crypto value, yet Bitcoin still held up better than assets long viewed as safer.
The drop marked a decisive break below the $80,000 level after two days of sustained selling. Bitcoin fell from the mid-$84,000 range to just above $78,000, wiping out roughly $5,400 per coin in a 6.4% slide. The selloff followed a failed rebound near short-term resistance, then accelerated once buyers stepped aside.
Bitcoin has recovered some ground and is now trading at $77,831.77 as of the time of writing.
Market stress showed up beyond crypto. Gold suffered a steep decline late in the week, plunging close to 10% between Thursday and Friday. Bitcoin fell around 5.6% over the same stretch. That gap caught the attention of traders scanning for relative strength during risk-off moves. For many newer participants, the smaller drawdown reinforced the view that Bitcoin is carving out its own role during periods of volatility.
Some investors treated the pullback as an entry point. On-chain data and exchange flows pointed to renewed accumulation near the lows, suggesting demand remained active even as prices slid. That behavior contrasted with sharper exits seen in parts of the commodities market.
From a technical standpoint, the damage was clear. Bitcoin lost its rising support line that had guided price action since late December. Once that level gave way, price cut through a cluster of supports between $86,000 and $82,000 in quick succession. The 50-day exponential moving average near $90,000 flipped from support to resistance, leaving overhead pressure firmly in place.
Trading volume surged during the breakdown. The spike signaled forced selling and leverage unwind rather than thin, low-interest trading. Daily candles showed little buying response, with no confirmed reversal pattern on the chart.
Momentum indicators weakened further. The relative strength index slid into the mid-20s, placing Bitcoin deep into oversold territory. Past cycles show that readings at these levels can spark short-term relief rallies, though they do not mark a trend change on their own.
Attention now turns to lower price zones. Chart structure highlights support in the low-to-mid $70,000 range, an area tied to prior consolidation and the lower boundary of a descending channel. Any recovery attempt faces pressure near $82,000 to $84,000, the zone Bitcoin needs to reclaim to stabilize the trend.
Longer-term views remain anchored to deeper technical references. In a post on X, James Wynn said $68,000 is the “probable” destination for Bitcoin, pointing to the 200-week moving average near $68,379. He described a return to that level as a reset to the “baseline,” adding that risk signs emerged near the $120,000 area.
Wynn raised the possibility of a sharper drop driven by “fear” and “panic,” floating $50,000 as a lower boundary he does not expect price to breach. That outlook reflects a personal scenario. On the chart, the 200-week average remains the clearest long-term marker traders continue to watch.
For now, Bitcoin sits in a fragile zone. Sellers control the short-term trend, buyers are testing conviction, and markets are waiting to see whether demand near current levels can slow the slide or if the reset Wynn describes moves closer into view.
Trending Now

Top Tech News Today, March 25, 2026