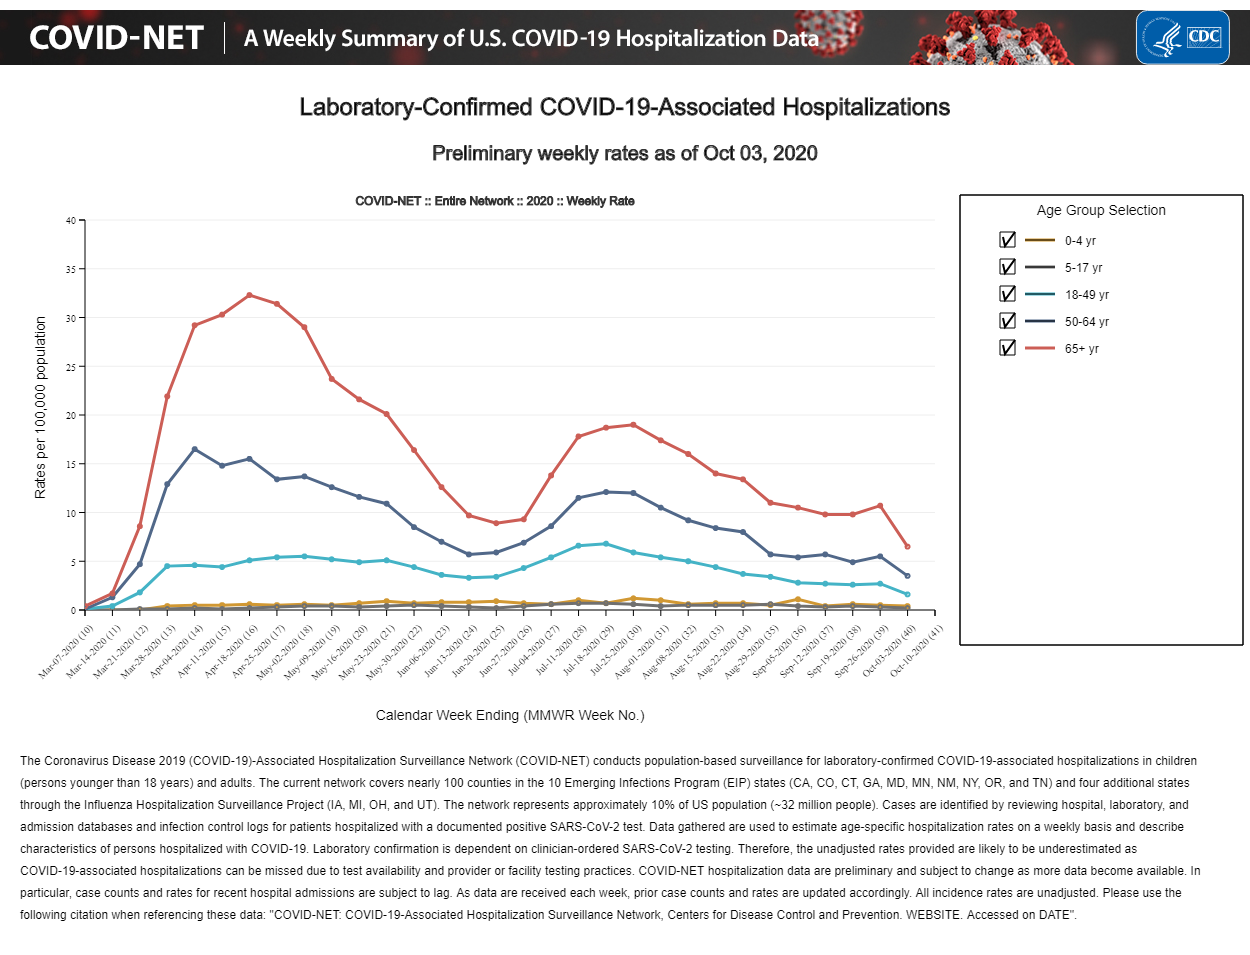
This is the coronavirus chart the mainstream media don’t want you to see: CDC data shows COVID-19 hospitalizations are fallen across all age groups

No day goes by without the fear-mongering from the mainstream media about how deadly coronavirus is. The media has succeeded in paralyzing Americans with fear that has resulted in many people losing their livelihood, their jobs, and in some cases, some people committed suicide due to the hopeless nature of things across the country. Unlike at the beginning of the virus outbreak, we’ve learned so much about the virus in the last nine months, including better testing, therapeutics, and how to better isolate and care for the most vulenrable among us.
However, what the media is not telling you is that even as the number of people infected with the virus increased, the number of hospitalizations is down, based on seven months of data from the CDC. One of the best indicators to show how well the nation is faring is not just based on the number of infections but the number of people admitted to the hospital for COVID-19 treatments. Even though the number of coronavirus cases is increasing, the number of hospitalizations continues to go down. This means that not everyone that has COVID-19 was admitted to the hospital. It could also mean that people infected with COVID-19 have immunity or getting the proper treatment they need at home without having to go to the hospital.
Since March 7, 2020, the CDC has been collecting data on laboratory-confirmed COVID-19-associated hospitalizations. Based on the data collected over the course of seven months, the CDC shows that the number of hospitalizations is down across the country.
Unlike the hospitalizations reported in national and state case counts, the CDC Coronavirus Disease 2019 (COVID-19)-Associated Hospitalization Surveillance Network (COVID-NET) is a population-based surveillance system that collects data on laboratory-confirmed COVID-19-associated hospitalizations among children and adults through a network of over 250 acute-care hospitals in 14 states.
According to the CDC, the Coronavirus Disease 2019 (COVID-19)-Associated Hospitalization Surveillance Network (COVID-NET) hospitalization data are preliminary and subject to change as more data become available. In particular, case counts and rates for recent hospital admissions are subject to lag. As data are received each week, prior case counts and rates are updated accordingly.
COVID-NET conducts population-based surveillance for laboratory-confirmed COVID-19-associated hospitalizations in children (less than 18 years of age) and adults. COVID-NET covers nearly 100 counties in the 10 Emerging Infections Program (EIP) states (CA, CO, CT, GA, MD, MN, NM, NY, OR, TN) and four Influenza Hospitalization Surveillance Project (IHSP) states (IA, MI, OH, and UT). Incidence rates (per 100,000 population) are calculated using the National Center for Health Statistics’ (NCHS) vintage 2018 bridged-race postcensal population estimates for the counties included in the surveillance catchment area. The rates provided are likely to be underestimated as COVID-19 hospitalizations might be missed due to test availability and provider or facility testing practices.


